Overview
My team of 5 computer science students were tasked with enhancing a basic command line interface desktop Addressbook3 application for software engineering project. Our team decided to morph the application to ExerHealth. ExerHealth is a desktop application used for tracking and scheduling the user’s exercises. The application has statistical analysis of exercises user have completed in the past. Additionally, it also acts as a personal trainer by suggesting different exercises which both beginners and advanced users can choose from to incorporate into their exercise regime. The user interacts with it using a command line interface, and it has a GUI created with JavaFX.
Figure below is a screenshot of what our application looks like:
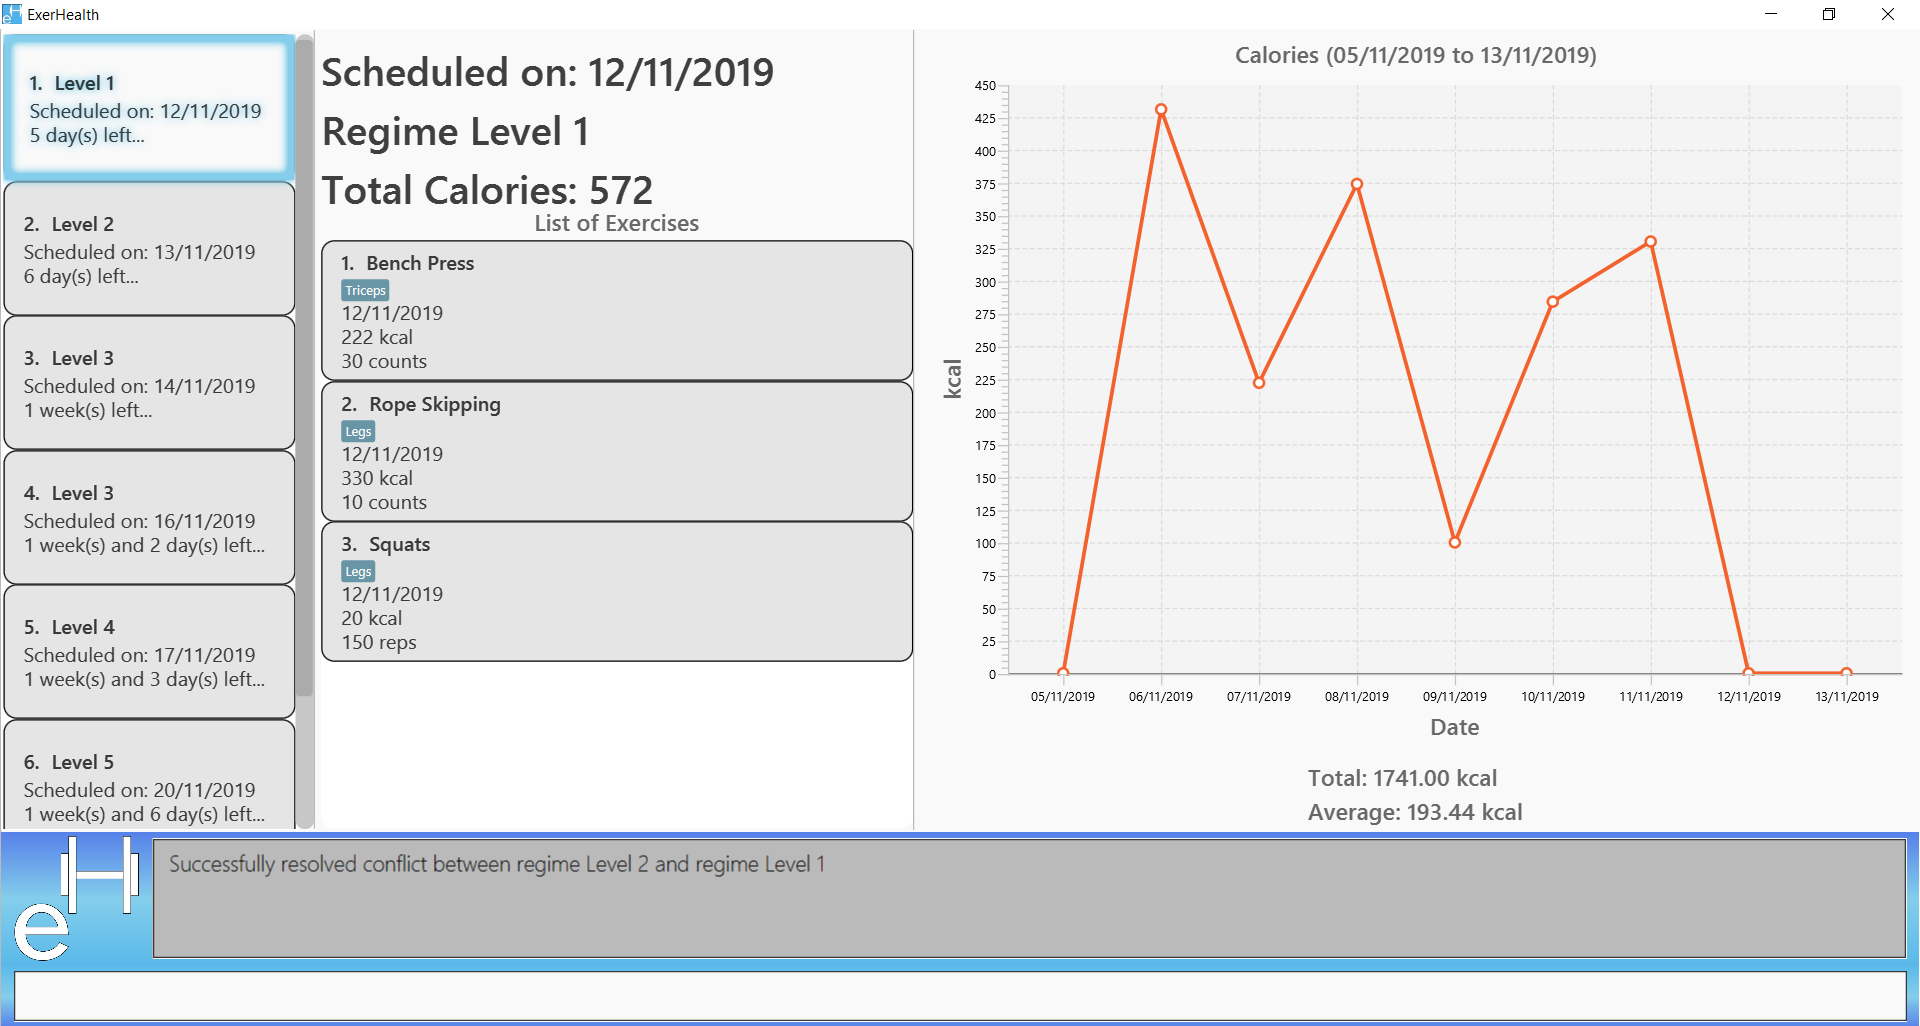
Figure 1. The graphical user interface for ExerHealth
My role was to develop the add and delete regime feature and statistic feature. The following sections illustrates these enhancements in more details, as well as the relevant documentation I have added to the user and developer guides in relation to those enhancements.
Summary of contributions
This section shows a summary of my coding, documentation and other helpful contributions to the team project.
-
Major enhancement: Added the ability to display statistic and charts which includes pie chart, line chart and bar chart.
-
What it does: The
statscommand will allow users to display chart and statistic of the exercise they have completed. -
Justification: This feature will enable users to have an overview of number of exercise they have completed and calories they have burnt. This will help users understand their progress and improve planning of exercises in the future.
-
Highlights: This enhancement works well with existing commands and commands to be added in future. It required an in-depth analysis of design alternatives to ensure that future enhancements can be made.
-
-
Minor enhancement 1: Added a
Unitproperty to exercise. -
Minor enhancement 2: Added add and delete regime command that allows the user to add and delete regime from regime list.
-
Code contributed: [RepoSense]
-
Other contributions:
Contributions to the User Guide
Given below are sections I contributed to the User Guide. They showcase my ability to write documentation targeting end-users. |
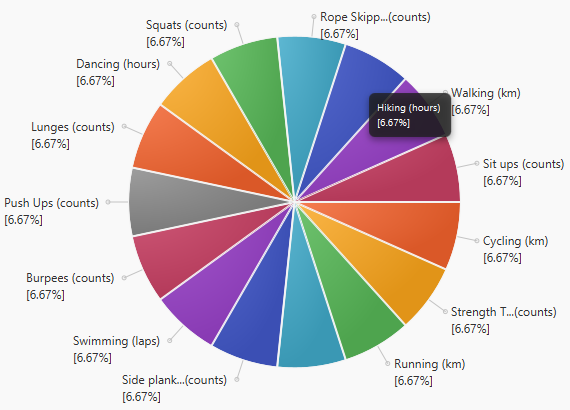
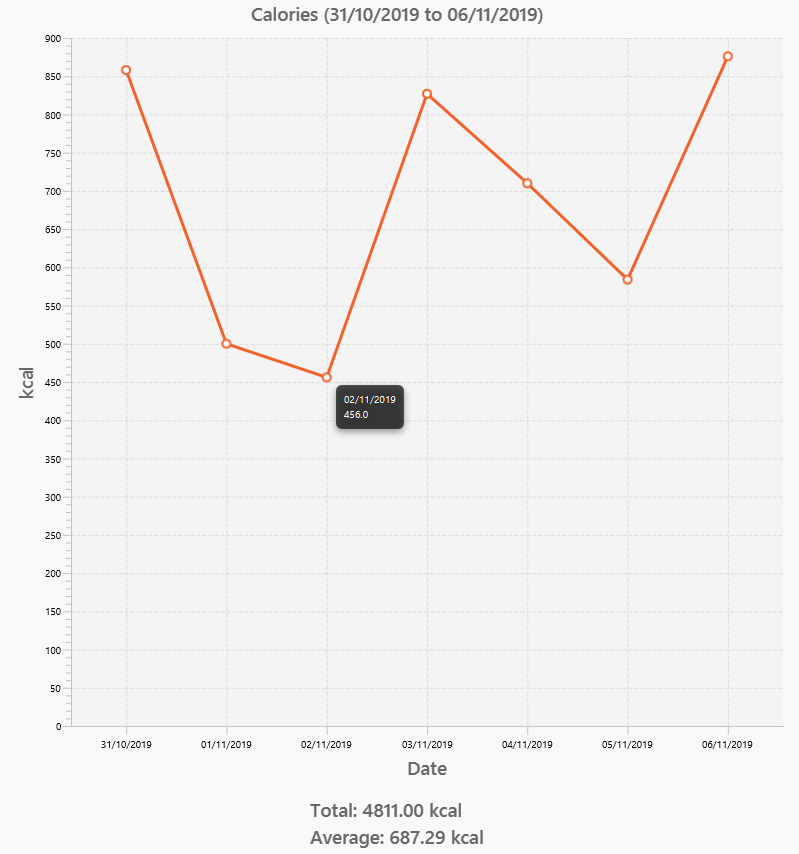
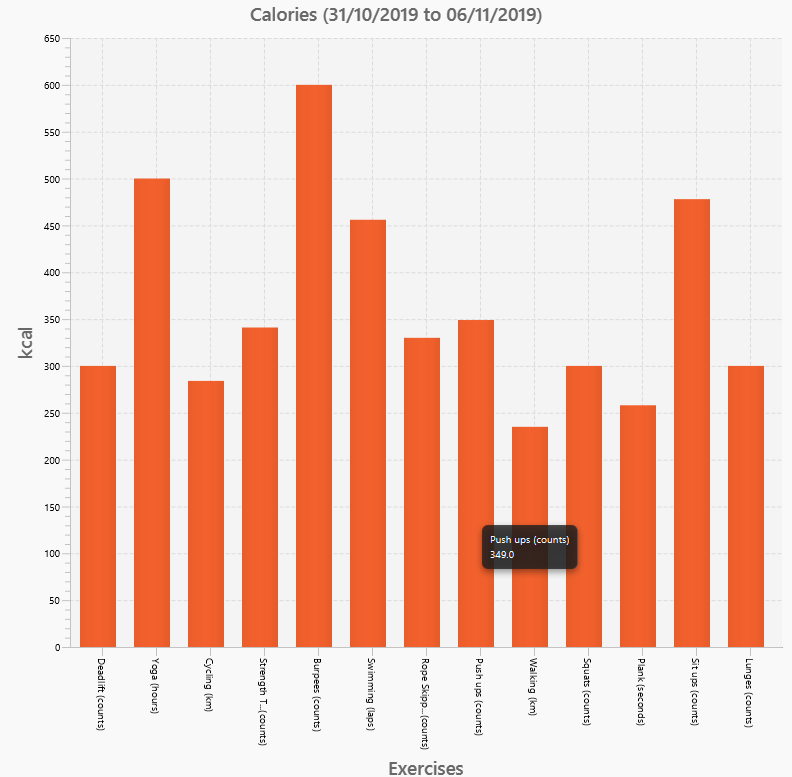
Display statistics : stats
Display the statistics of exercises in completed exercise list.
Format: stats t/CAT_NAME h/CHART_TYPE [s/START_DATE] [e/END_DATE]
| Due to space constraint, some labels may not appear. Tooltips can be seen when mouse cursor hovers over the chart. |
Example:
-
stats t/exercise h/piechart
-
stats t/calories h/linechart
-
stats t/calories h/barchart s/31/10/2019 e/06/11/2019
Contributions to the Developer Guide
Given below are sections I contributed to the Developer Guide. They showcase my ability to write technical documentation and the technical depth of my contributions to the project. |
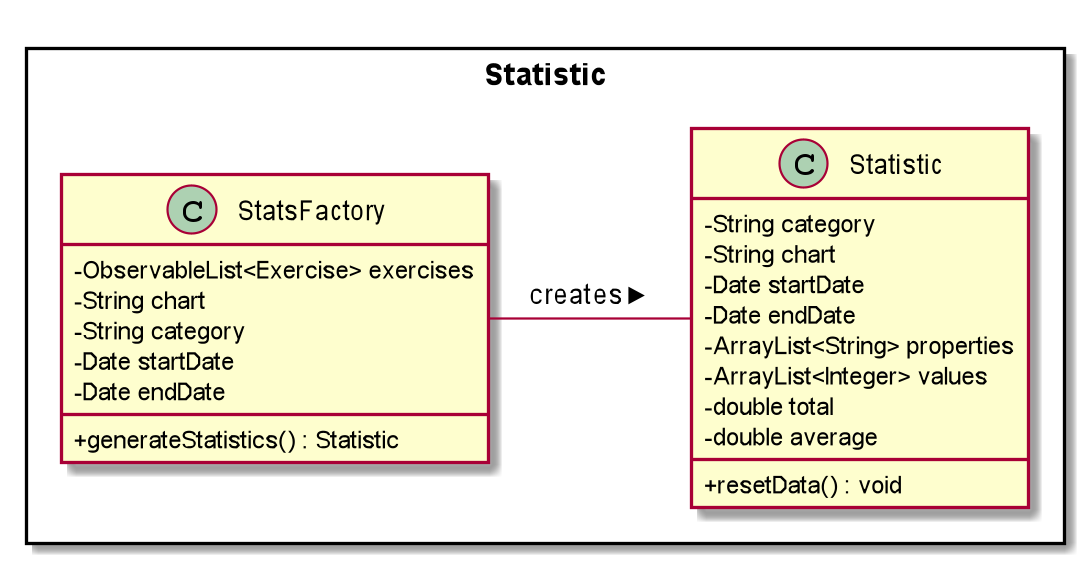
Statistics
Implementation
Statistics of exercises will be displayed in charts. Supported chart types are Pie Chart, Line Chart and Bar Chart. StatsFactory will create Statistic using given parameters. The figure below shows the class diagram of statistics:
The next figure shows the activity diagram when user enter a stats command:
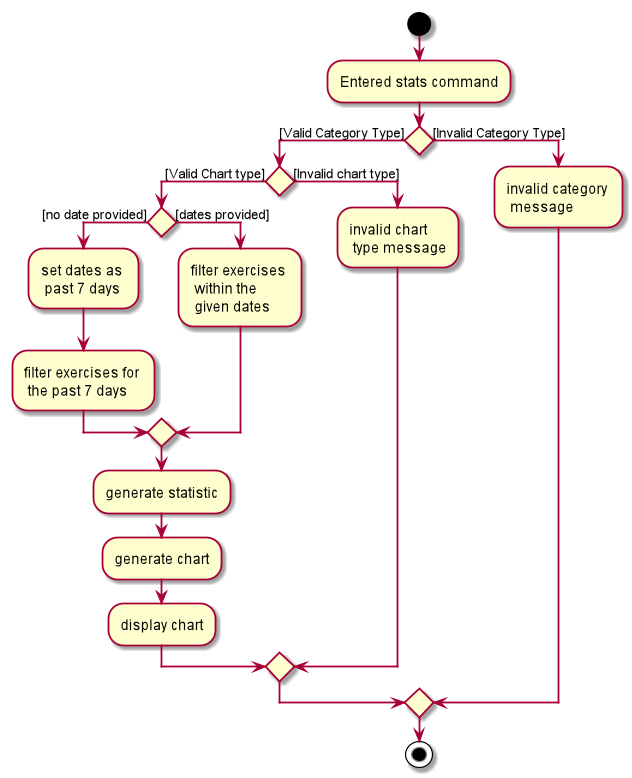
stats commandGiven below is an example usage scenario of statistics feature.
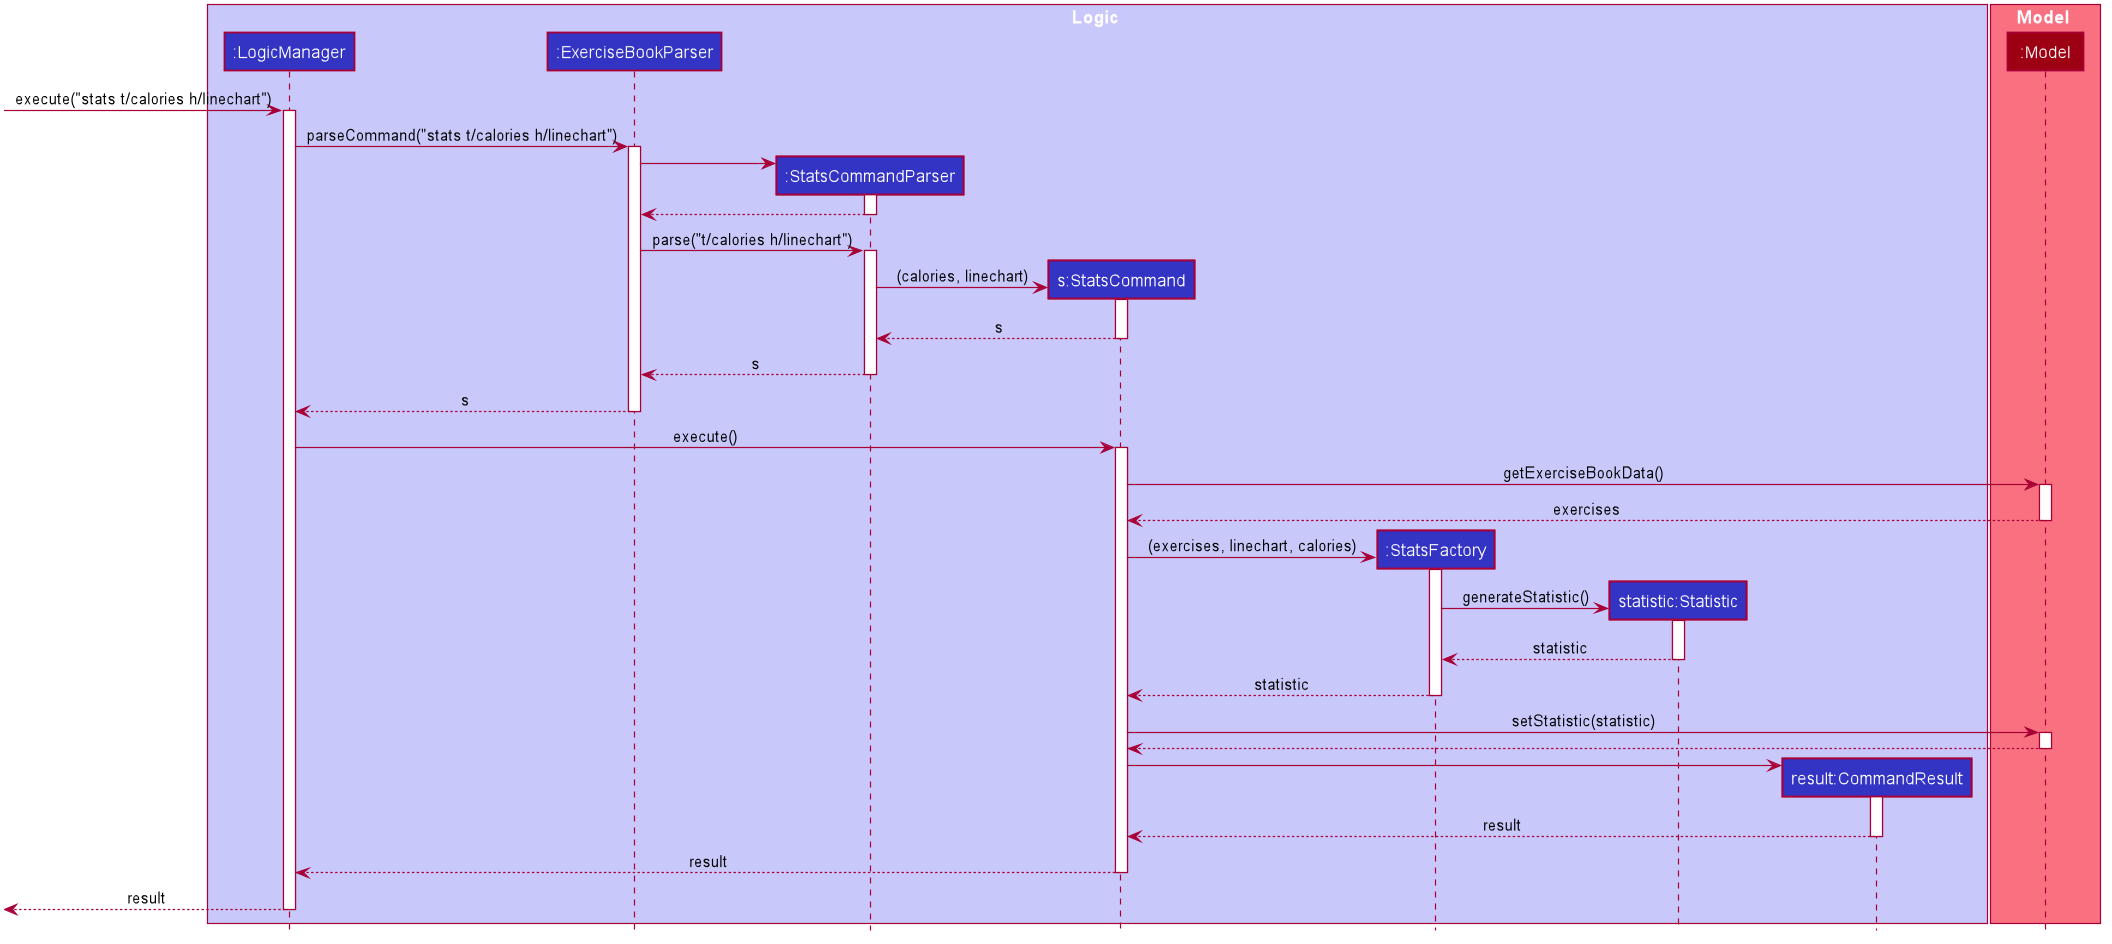
Step 1: User enters a stats command to see statistics of exercises.
Step 2: ExerciseBookParser will receive command from LogicManager and pass command to StatsCommandParser.
Step 3: StatsCommandParse will parse the command and creates a StatsCommand.
Step 4: StatsCommand calls Model#getExerciseBookData to get data of all exercises.
Step 5: StatsCommand creates a StatsFactory and pass exercises data, chart and category to StatsFactory.
Step 6: StatsFactory will then generate Statistic and return to StatsCommand.
Step 7: StatsCommand then calls Model#setStatistic to set the Statistic in Model.
Step 8: StatsCommand creates a new CommandResult and return to LogicManager.
Shown below is the sequence diagram when user enters a valid stats command:
stats command